

NumLM
LEARN · SIMULATE · VERIFY
From probability to LLMs — a self-paced learning platform that teaches the principles properly
From probability to LLMs — a self-paced learning platform that teaches the principles properly
Association rule learning is an unsupervised learning task that finds patterns of items appearing together — such as "customers who buy A also buy B" — using support, confidence, and lift, while anomaly detection is an unsupervised learning task that finds observations that deviate sharply from the normal pattern.
Click a step to view its lesson content
Progress (completed steps)
0%
Association rule learning and anomaly detection are unsupervised learning tasks: they uncover the structure hidden in data without any answer labels. Association rule learning looks for "combinations of items that frequently appear together" (the classic example is market basket analysis), while anomaly detection does the opposite — it looks for "the few observations that deviate sharply from the normal pattern of the majority." One targets the common patterns of the many; the other targets the exceptions of the few. In that sense they are mirror images of each other.
Observing 10 convenience-store receipts (an educational scenario): Looking through 10 receipts, you find that 5 of them include bread, and 4 of those 5 also include milk. The confidence of the rule "bread → milk" is 4/5 = 80%. But milk is a popular item to begin with — it appears on 5 of the 10 receipts (50%). Knowing that bread was bought raised the probability of milk from 50% to 80%, so this rule shows an association beyond chance (lift 0.8/0.5 = 1.6). Now suppose you look at the payment amounts at the same store. Most fall between ₩3,000 and ₩20,000 — and then one day a single ₩900,000 charge appears at 3 a.m. That observation, far outside the normal pattern of the majority, is an anomaly candidate. Card issuers automatically flag transactions like this and call to verify them.
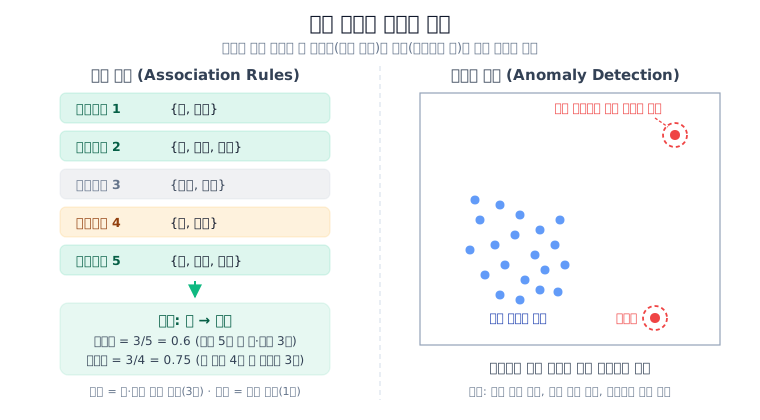 Left: counting the support (0.6) and confidence (0.75) of the rule "bread → milk" across 5 baskets. Right: an observation far from the normal cluster is flagged as an anomaly.
Answer: Because both tasks find structure using only the frequencies and distribution of the data itself, without answer labels (such as "this combination is a good rule" or "this transaction is fraud"). Association rules are built from how often items appear together, and anomaly detection uses the normal pattern formed by the majority of the data as a baseline to find exceptions.
Answer: If milk is a popular item found in almost every basket, then attaching "→ milk" to any item — regardless of bread — will produce a high confidence. Lift measures "did knowing that bread was bought actually raise the probability of buying milk above its baseline?" Only when lift is greater than 1 can you say the association goes beyond chance.
Answer: They are fields like fraud, equipment failure, and network intrusion, where "normal cases overwhelmingly outnumber abnormal ones, abnormal cases are very rare, but missing one is costly." Because it is hard to collect enough labeled abnormal cases, an unsupervised approach that measures deviation from the normal pattern without labels is the natural fit.